Research has shown that only around 15 percent of failures can be predicted based on time or hours run and 85 percent of failures occur randomly throughout the life of a component. This means that if we are carrying out the majority of our preventative maintenance by replacing or overhauling equipment based on hours or cycles run, then we are wasting precious resources. To progress beyond these preventative and inherently wasteful routines we must gain a better understanding of our equipment to enable us to identify an appropriate condition based monitoring routine.
With time-random failures, the simplest management strategy is to inspect equipment and look for evidence of degraded condition. For this, we can use a continuous means of monitoring condition by trending equipment performance graphically (e.g. power versus throughput) or by introducing periodic inspections of equipment condition through observation and data measurement (e.g. lubrication sampling, temperature or vibration measurement etc.).
To introduce effective condition monitoring routines we must gain an understanding of two key points. The most appropriate parameter to measure and how often to measure it. Different effects can be measured and the first step is to identify which of these is going to give us the most relevant data. They can be categorised as:
- Dynamic effects – these apply especially to rotating parts which cause abnormal amounts of energy emissions in the form of waves such as vibration and acoustics.
- Temperature effects – a change in temperature of the equipment in use.
- Particle effects – discrete particles of varying size and shapes are released into the environment in which the equipment is operating (usually the lubricant).
- Chemical effects – traceable amounts of chemical elements released into the operating environment (again, usually into the lubricant).
- Physical effects – changes in appearance or structure in the form of cracks, fractures, dimensional changes and wear.
- Electrical effects – changes in conductivity, resistance and potential.
For each effect there is a selection of techniques that can be used to measure changes. The most appropriate will depend on the equipment type, access, availability of measuring equipment and cost. Usually, the method of detection is straightforward and the more difficult part is determining the frequency to carry out the checks. Condition monitoring can be expensive so we must preserve our resources whilst carrying out the checks often enough to pick up signs of functional failure with sufficient time to plan and carry out corrective maintenance. This is a balancing act.
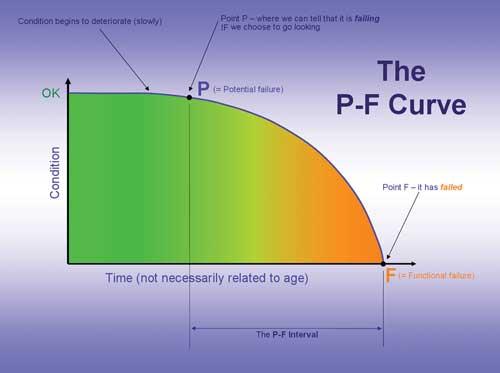
One method for determining the inspection frequency is to plot the P-F curve for the equipment. This shows the failure curve and the time between when potential failure can be picked up and when the equipment reaches functional failure. If we can determine the P-F interval then we can set our condition monitoring routine to use our resources effectively whilst ensuring we pick up signs of potential failure in plenty of time.
The difficulty comes in obtaining sufficient data to enable us to plot the curve. In industries where the consequence of equipment failure is high, such as aviation or nuclear power, it is common for manufacturers to carry out extensive testing to plot this curve. The problem is of course that to carry out this type of research is expensive, so in general industry where the consequence of equipment failure is not so critical then the testing will be limited. Maintenance schedules from original equipment manufacturers (OEMs) are based on this type of testing but we often do not know the extent of the testing or under what conditions it was carried out. Also, the equipment we are operating has often been in service for many years and has been modified to our particular needs so the OEM maintenance schedule becomes quite meaningless.
This leaves us in the position of having to determine the inspection frequency using the data we have available to us. If we have an established CMMS, holding large quantities of quality data on failure modes and frequency then we can use that data to help us. In my experience though, few organisations have the confidence to rely on the data held in the CMMS. This is usually down to the way the CMMS has been set up, lack of training and lack discipline when closing out work orders. This is another subject for another day but there is little point holding data that we don’t have the confidence to use!
The only way to build up the data needed to implement effective condition-based monitoring routines is to do the hard yards. If we are currently replacing bearings annually for instance and we want to move to a more proactive technique then we must decide the most appropriate technique and start taking data. In some cases there is sufficient knowledge available around vibration signatures or oil analysis results, for instance, to allow us to move immediately from scheduled replacement of the bearing to condition monitoring. In other instances we will need to compare the data from condition monitoring to the physical bearing condition when we carry out an inspection to allow us to build up that data. The golden rule is that for every condition monitoring task undertaken, data must be taken, recorded and analysed.
The key to moving beyond scheduled replacement or reconditioning tasks and onto condition-based monitoring is to understand the relationship between the data we are reading and the physical condition of the equipment. Whether we are monitoring current draw, vibration, oil contamination or any other parameter, we need to understand what that data is telling us. From the data we are taking, we must be able to identify impending failure with sufficient time to plan and carry out corrective maintenance – this is the sole purpose of carrying out the task. Condition monitoring will allow us to move away from wasteful preventive maintenance and on to predictive and proactive techniques and to tailor those techniques to the operating context of our equipment.


